Highlights
- Bitcoin ETF netflows have hit roughly +$21.9 billion over a rolling 30-day window, per CryptoQuant, as BTC trades near $78,400.
- The ETF cohort's realized price sits around $72,000-$73,000, meaning the price is now back above holders' average cost basis.
- CryptoQuant says the shift began in mid-August, when a five-day stretch (Aug. 17-21) alone brought roughly $19.6 billion in net inflows as BTC ran from the low-$60,000s toward $80,000.
- Spot Bitcoin ETFs have separately logged their strongest three-week run of 2026, pulling in $3.8 billion including a single $986.9 million week tied to dovish Fed commentary.
Bitcoin's spot ETF cohort has flipped from net seller to net buyer over the past month, according to on-chain analytics firm CryptoQuant, with 30-day rolling netflows now standing at roughly +$21.9 billion. The shift comes as BTC trades near $78,400, a level that puts the price back above the ETF cohort's estimated realized price — the average cost basis of ETF-held coins — of roughly $72,000 to $73,000. CryptoQuant frames the move as more than a short-term bounce: it says the demand regime itself has changed, with fund flows turning strongly positive after a stretch earlier this year when ETF issuers were net sellers into a falling market.
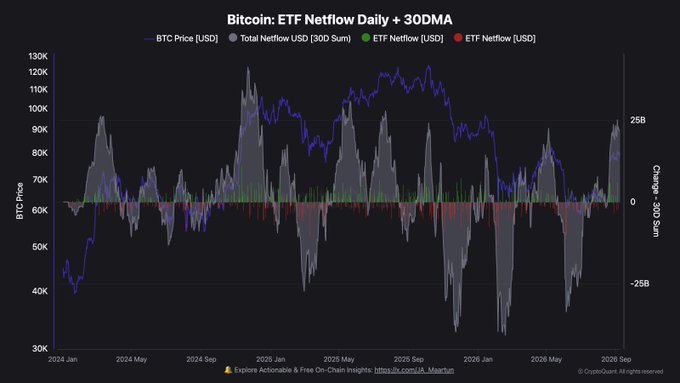
CryptoQuant traces the inflection to mid-August. Between August 17 and 21 alone, the firm says ETF netflows totaled roughly +$19.6 billion — a five-day stretch that coincided with Bitcoin's climb from the low-$60,000s toward $80,000. That kind of concentrated buying is unusual even by the standards of a market that has seen repeated multibillion-dollar inflow weeks since the ETFs launched, and it suggests a relatively small number of large allocators moved decisively rather than flows building gradually across many smaller buyers.
More recent data points in the same direction. US-listed spot Bitcoin ETFs logged their strongest three-week inflow stretch of 2026 heading into September, pulling in a combined $3.8 billion, including a single week that brought in $986.9 million — the funds' best single-week haul in nine months — after dovish commentary from a Federal Reserve governor lifted risk appetite. BlackRock's IBIT and other large funds have posted repeated multi-day buying streaks over the same window, reinforcing CryptoQuant's read that institutional allocators, not retail traders, are driving the current leg of demand.
Why the Realized-Price Crossover Matters
The realized-price crossover matters because of what has historically followed it. CryptoQuant's own data shows Bitcoin has reclaimed its short-term holder realized price — the average cost basis of coins bought in the last several months — twice since 2023, and both prior instances preceded rallies of at least 30% as the newest buyers moved from underwater to profitable and reduced their incentive to sell. A similar dynamic applies to the ETF cohort specifically: funds have already posted their biggest single-day inflow since January in recent sessions, and BlackRock's IBIT clients bought $687 million of Bitcoin over a three-day streak even as the broader market digested the rally.
Related: Bitcoin On-Chain Data Splits: OG Holders Stir as Realized Cap Turns Positive
When the average ETF holder is sitting on a paper profit rather than a loss, the funds' natural redemption pressure — investors pulling money out to cut losses — tends to ease, which can make a rally more self-reinforcing. That said, the same mechanism cuts both ways: a sharp drawdown back toward the $72,000-$73,000 realized-price zone would put a large share of ETF-held coins underwater again and could reintroduce the selling pressure that marked the earlier part of the year, before this month's reversal. CryptoQuant has flagged other Bitcoin demand signals fading in parallel, a reminder that the ETF-flow picture is one input among several the firm tracks.
What Comes Next
CryptoQuant's framing suggests the next test for the "flipped" demand regime is whether ETF netflows can sustain a positive run through a full calendar month rather than concentrating in a handful of outsized days like the August 17-21 stretch. Traders will also be watching whether BTC can hold above the $78,000-$80,000 zone through the next round of US macro data and Federal Reserve commentary, given how directly the recent rally has tracked shifting rate-cut expectations. A retreat back toward the $72,000-$73,000 realized-price band would be the clearest signal that the regime shift CryptoQuant is describing has stalled rather than taken hold.
FAQ
What does it mean that Bitcoin ETF netflows "flipped"?
CryptoQuant says spot Bitcoin ETFs moved from net outflows earlier this year to roughly +$21.9 billion in net inflows over a rolling 30-day period, signaling a shift in institutional demand.
What is the ETF cohort's "realized price"?
It is the average cost basis of coins held across spot Bitcoin ETFs, which CryptoQuant estimates at roughly $72,000 to $73,000 — a level Bitcoin's current price of about $78,400 now sits above.
Why did ETF inflows spike between August 17 and 21?
CryptoQuant attributes the roughly $19.6 billion five-day inflow surge to a wave of concentrated institutional buying as Bitcoin rallied from the low-$60,000s toward $80,000, though the exact buyers aren't disclosed.
What would reverse this demand shift?
A drop back toward the $72,000-$73,000 realized-price zone would put a larger share of ETF-held coins underwater, which has historically increased redemption pressure and selling from the fund cohort.