Highlights
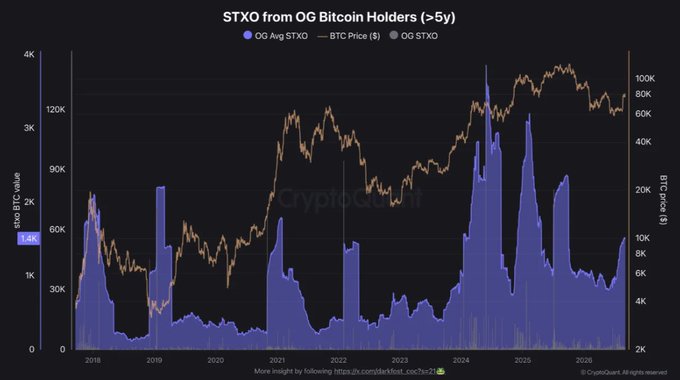
- CryptoQuant data shows the 90-day average of coins moved by holders older than five years has climbed to about 1,500 BTC, twice May's level.
- CryptoQuant analyst Darkfost says the current consolidation "has introduced some doubt across nearly every type of investor, even the most seasoned ones like the OGs."
- Bitcoin's realized market cap saw its 30-day change rate turn positive on Aug. 24 after 87 consecutive days in negative territory.
- That rate climbed to +0.88% by Sept. 6, with realized cap reaching $1.068 trillion, up $9.36 billion over 30 days.
- The two signals point in different directions even as BTC continues to trade near the $80,000 level.
Two Signals, One Consolidation
Two CryptoQuant analyses published this week paint a split picture of Bitcoin sentiment during its ongoing consolidation near $80,000. Analyst Darkfost flagged that the 90-day moving average of coins moved by wallets holding Bitcoin for more than five years — the "OG" cohort — has climbed to roughly 1,500 BTC, double where it stood in May, a sign that even long-term conviction holders are showing some hesitation. At the same time, fellow CryptoQuant analyst Axel Adler Jr. reported that Bitcoin's realized market capitalization saw its 30-day change rate turn positive on August 24 for the first time in 87 days, and that the rate has kept climbing since.
What the Data Actually Shows
Darkfost's data centers on spent-output activity from wallets that have held their coins untouched for over five years. The 90-day moving average of that spending climbed to about 1,500 BTC, twice the level recorded in May — a jump that doesn't necessarily mean OG holders are selling outright, since some of that movement can reflect coins shifting to new custody setups, a pattern that picked up after a recent hardware-wallet vulnerability prompted holders across the market to migrate funds. Even accounting for that caveat, Darkfost's framing was blunt: "This consolidation period seems to have introduced some doubt across nearly every type of investor, even the most seasoned ones like the OGs."
Adler's realized-cap data tells a more constructive story. According to CryptoQuant, the ratio measuring Bitcoin's realized market value net position change turned positive at +0.10% on August 24 — its first positive reading since late May — before climbing to +0.88% by September 6. Realized cap itself, a measure of the aggregate cost basis of every coin in circulation, reached $1.068 trillion, adding $9.36 billion over the trailing 30 days. Adler has separately noted that Bitcoin's 30-day visible demand has outpaced new supply by roughly 2.5 times for six straight days, a combination he says puts the market within range of a bull-market threshold.
Reading the Mixed Signals
Read together, the two data sets aren't necessarily contradictory — they're measuring different things. OG holder movement is a proxy for long-term conviction, while realized cap tracks the market's aggregate cost basis, which rises as coins change hands at higher prices regardless of who's doing the selling. It's possible for seasoned holders to trim positions into strength while the broader cost basis still climbs, particularly if newer buyers are absorbing the coins OGs are moving. That's consistent with mid-size whale wallets adding a reported 73,300 BTC in their best accumulation run since April — a cohort that would be a natural counterparty if OG coins are rotating into new hands rather than being dumped on exchanges.
Related: Bitcoin's Stablecoin Demand Signal Starts to Fade, CryptoQuant Data Shows
For traders, the practical takeaway is that Bitcoin's on-chain data doesn't offer a clean signal in either direction right now. A rising realized cap alongside steady ETF and treasury-company demand would normally read as bullish confirmation of a demand-led market, but rising OG activity is the kind of metric that has historically preceded distribution phases in past cycles. With BTC still rangebound and thin supply above $78,000 reportedly opening a path toward the $84,569 level, the next move likely hinges on whether OG coins are being absorbed by new demand or added to available exchange supply.
What to Watch Next
The clearest way to resolve which signal wins out is watching whether the OG cohort's spent-output activity keeps climbing or fades back toward its May baseline over the coming weeks — a sustained rise would tilt the read toward distribution, while a pullback would support Adler's more constructive framing. Equally important is whether the realized cap's 30-day change rate can hold above zero through September; a reversal back into negative territory would suggest the August 24 turn was a brief blip rather than the start of a durable shift in cost basis. Both metrics update daily on CryptoQuant's dashboards, giving the market a near-real-time read on which of the two stories — hesitant OGs or resilient demand — ends up describing this consolidation correctly.
FAQ
What does it mean when Bitcoin's "OG holders" move coins?
OG holders are wallets that held Bitcoin untouched for more than five years; when their spent-output activity rises, it can signal weakening long-term conviction, though it can also reflect coins moving to new storage rather than being sold.
What is Bitcoin's realized market cap?
Realized cap values every coin in circulation at the price it last moved on-chain, making it a measure of the market's aggregate cost basis rather than current market price.
Why does the realized cap's 30-day change rate matter here?
It turned positive on August 24 after 87 consecutive days in negative territory, and CryptoQuant data shows it climbing to +0.88% by September 6, pointing to an improving cost-basis trend.
Are these two signals contradictory?
Not necessarily — OG movement reflects long-term holder behavior while realized cap tracks the market's overall cost basis, so both can move in different directions during the same consolidation period.